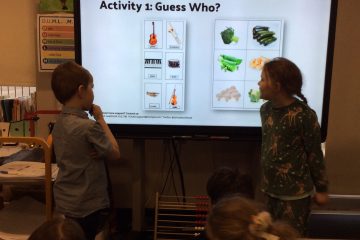
On Friday we had a look at how to create a spreadsheet and collect data. We decided to do collect an array of data. We had a look at everybody’s favourite fast food place and also how we get to school. We then colour coordinated the data and worked together to represent this as both a bar chart and a pie chart. We had lots of fun doing this and we all got the hang of it!
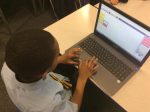
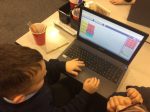
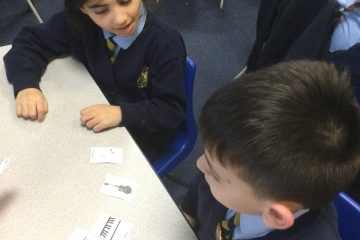
Entering the data that we collected
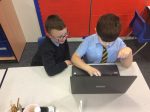
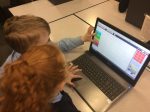
Taking turns typing in the data
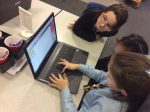
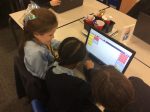
Working together
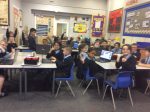

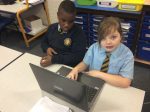
Spreadsheet fun!

6 Comments
mcfinley · 27th January 2019 at 2:52 pm
I enjoyed spreadsheet fun so thanks.
Miss Marshall · 27th January 2019 at 3:07 pm
I am glad you had fun!
Mcfinley · 3rd February 2019 at 1:24 pm
I always enjoy your tasks u give
us.
charlie ff · 29th January 2019 at 5:19 pm
I really enjoyed spread sheet fun as well thankyou so much miss
charlie ff · 18th February 2019 at 11:27 am
I really enjoyed spreadsheet but it ended I even did my own spreadsheet on purple mash on sunday.
Miss Marshall · 27th February 2019 at 3:41 pm
I am very impressed!