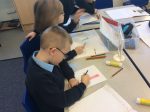
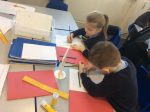
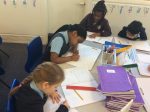
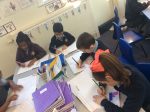
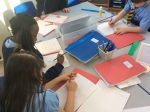
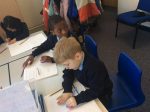
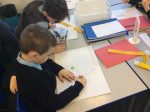
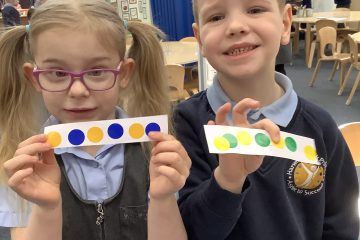
 In class 6 this week we have been looking at Statistics. We have interpreted different types of data to ask and answer questions. The children did an investigation into what the favourite colours of the class were, and from the information we collected we were able to construct our own pictograms and block diagrams. Some of us were able to think of questions we could ask, such as which colour had to most votes, and what was the difference between votes for red and green.
Categories: Class 13 (2023)Mathematics

0 Comments