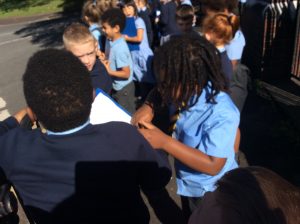
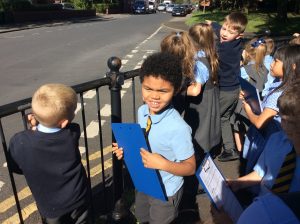
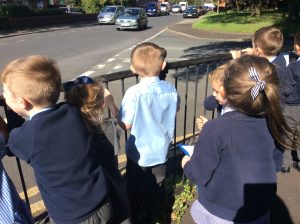
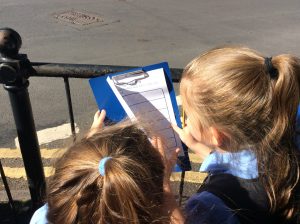
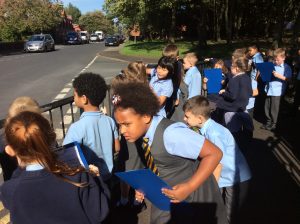
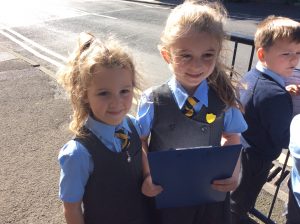
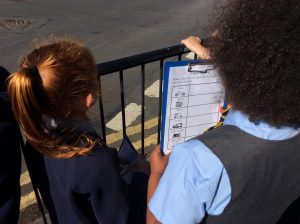
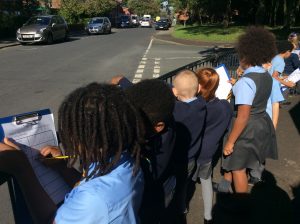
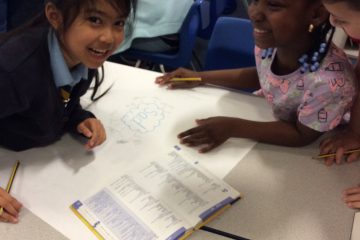
As part of our Linked Learning theme Class 5 have been thinking about how safe our local area is. Today we went outside to find out if our school is on a busy road. We observed different vehicles on the road and kept a tally chart of those we saw. When we returned to class we presented our results in a block graph. Which vehicles did we see the most? Which vehicles did we not see?

Class 7
World book day 2024 – dress as a word!
Today for world book day, class 7 enjoyed lots of vocabulary activities. One of these activities involved a class competition where the children had to work in table groups to see who could find the Read more…
0 Comments